1The problem
Support needed to make two arguments at once: that the people they had should stay, and that they should get budget for AI tooling to hold their SLAs against a customer base growing faster than the team was. Neither argument had evidence behind it.
The team's own belief was that their work changed how customers behaved. My team thought it plausible. Nobody had ever tested it, and now it was going into a room where every other team was making its own pitch.
The question I was given was whether the effect existed at all. The question I had to answer first was whether the data could support an answer either way.
2The approach
The temptation with a question like this is to compare two averages and call the difference a lift. I built a decision tree instead, where each test only runs if the previous one earns it.
It starts with whether the data behaves. A Kolmogorov-Smirnov test came first, before anything else, and both groups came back decisively non-parametric. That single result ruled out the parametric tests most people reach for by default and sent the whole study down the other branch. Had it gone the other way the path was ANOVA and a paired t-test, and that was written down in advance.
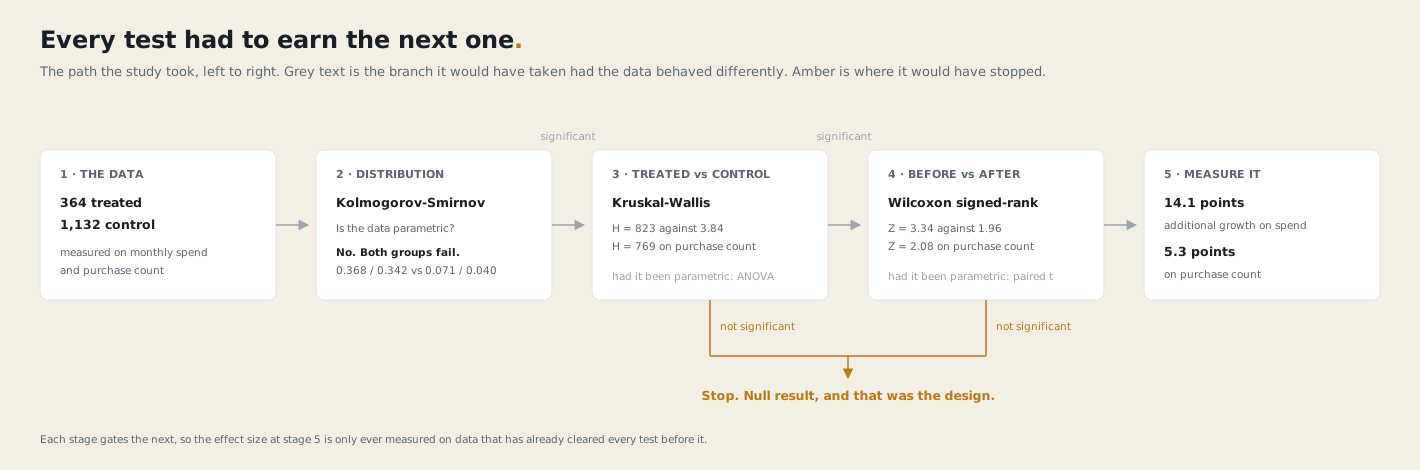
From there, two more tests, either of which could have ended it: whether the treated and control groups differed at all, and whether the treated group changed within itself, before against after. Only when both cleared did I measure the size of the difference. If either had failed, the study would have stopped there with a null result. That was the design, not a consolation.
The treated group was defined by explicit criteria rather than by whoever happened to appear in the data: an active, non-seasonal customer, with at least two Support tickets, the first of them well before the observation window opened. The control group was drawn from customers outside that set with activity across the same window.
3The outcome
of additional growth in monthly spend, treated group against control.
Indexed to a baseline of 100 across the observation window, the treated group's monthly spend moved to 127.7 while the control moved to 113.6. On purchase count, 119.4 against 114.1. The gap is consistent across both measures, and on every test it is decisive rather than marginal: the Kruskal-Wallis statistic came in at 823 against a threshold of 3.84.
Support's caseload sits on the most active part of the customer base. The treated group's baseline spend is 2.95 times the control's, and its purchase count is 3.78 times, so they buy more often and spend about 22% less each time. That is largely by construction: customers who buy three or four times as often have three or four times as many chances to hit a problem.
That is the finding that made the case, and it does not depend on the growth number at all. Support quality sits directly on top of the most active revenue on the platform, so underfunding that team is a concentrated risk whether or not Support drives growth. The argument rests on who is on the other end of the tickets.
The study went into that conversation. Support came out of it with its team intact and the tooling approved.
4The open questions
The 14 points are where I would be careful. They are real and every test is decisive, but the same ratios that put Support on top of the best customers also mean the two groups were never comparable. Nobody assigned these customers; they selected themselves by raising two tickets. So this design cannot separate what Support did from what that kind of customer was going to do anyway.
That is a solvable problem, and it is the study I would run next.
Match before comparing. The groups differ on exactly the things most likely to drive growth. Pairing each treated customer with an untreated one on baseline spend and frequency, rather than comparing the two pools wholesale, would remove most of the selection effect. Same test chain, comparable groups.
Use the timing. Customers did not all contact Support on the same date. Comparing each customer against their own first-contact date, and against customers who had not yet made contact in that period, turns the self-selection into something closer to a natural experiment.
Open up the interaction. The study treats Support as binary: contacted or not. Response time, resolution time and ticket type were all in the data and none were used. If Support does influence behaviour, the mechanism shows up there. Satisfaction ratings existed too, but for too few customers and almost uniformly high, so they would have added noise rather than signal.
Then retention. The question everyone asks first, and the one this study still does not answer.