1The problem
Devon Corporation's nine retirement-living locations each had their own reporting, no standard definitions, and no view of the portfolio as a whole. The brief: build the first portfolio-level executive dashboard — something a board could read in 30 seconds and walk away from with a specific place to focus attention and capital, not a data dump.
2The approach
Before touching Tableau, I modelled the data properly. Source tabs (locations, units, resales, contracts, NPS, monthly metrics) went through a staging → intermediate → marts layer, deliberately not flattened into one join — the source tables had different grains and didn't reconcile with each other by design, so forcing a single flat table would have quietly fabricated relationships that weren't real. Each mart answers one question at one grain, connected in Tableau via relationships rather than physical joins.
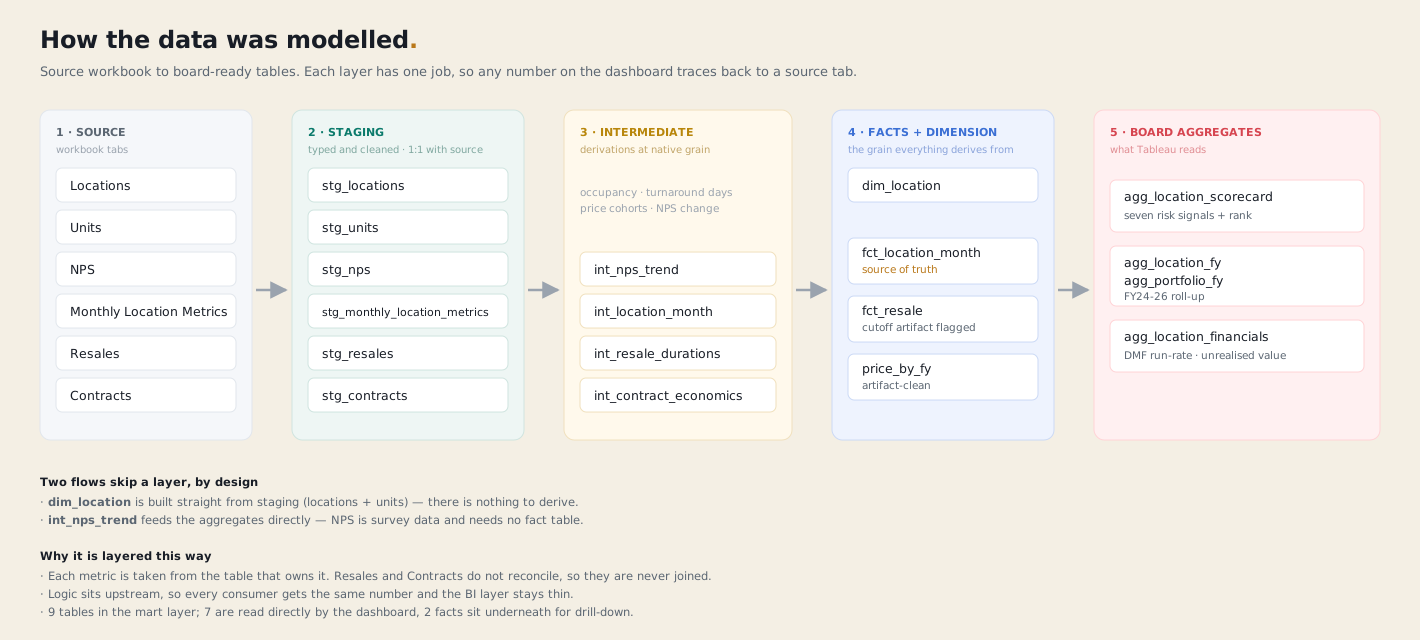
The finding that mattered — one site driving the whole portfolio's decline — didn't come from eyeballing a chart. I ran three independent tests (a control chart, trend regression, and an ANOVA) rather than asserting a pattern from a trend line, and adopted a standing rule partway through: before any claim goes on a slide, check it against all nine sites and for materiality. That rule caught and corrected four over-claims during the build — including a "3x the next site" figure that was actually 2.25x once checked properly.
3The outcome
of the portfolio's net occupancy decline traced to a single site.
The dashboard's visual grammar does one job: neutral everywhere, with a single emphasis colour reserved for the hero numbers and the one site that needed attention. Red (or in this fictionalised version, the same idea in a neutral accent) doesn't decorate — it points. The recommendation that followed was specific and dollar-quantified, not "investigate further": diagnose the service and resale drivers at that one site, because clearing its vacancy alone would release close to $10M in capital.
4What I'd take into a team
This is the clearest example I have of BI work held to the same bar as an analysis — every number on the dashboard is defensible in the room, because the modelling and the statistics were done before the first chart was built, not after.