1The problem
Devon Corporation's retirement-living locations each had their own reporting, no standard definitions, and no view of the portfolio as a whole. The brief: build the first portfolio-level executive dashboard, something a board could read in 30 seconds and walk away from with a specific place to focus attention and capital, not a data dump.
2The approach
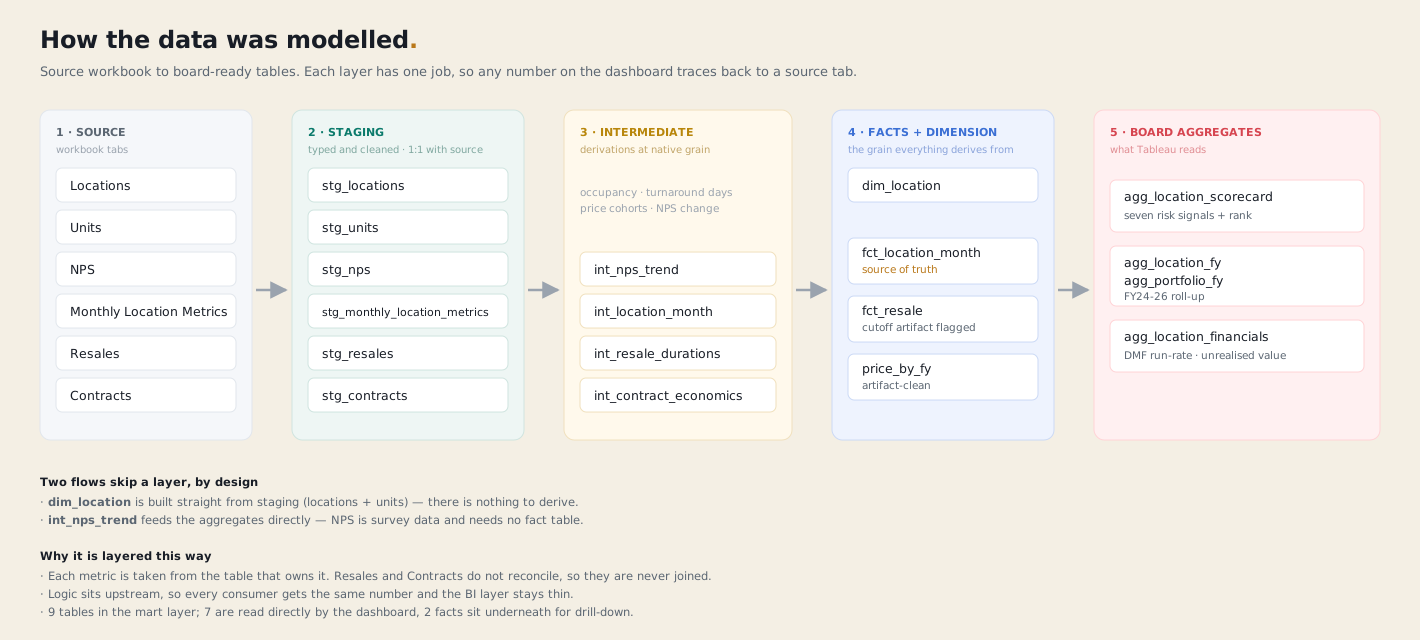
The source tables had different grains and didn't reconcile with each other by design, so flattening them into one join would have quietly fabricated relationships that weren't real. Instead, the source tabs went through staging → intermediate → marts, each mart answering one question at one grain, connected in Tableau via relationships rather than physical joins.
One site accounting for the whole net decline is arithmetic rather than inference: occupied units fell 15 across the portfolio and 15 at that one site, with every other site netting to zero, and it holds on gross declines too (that site is 65% of them). Elsewhere, where a pattern could have been asserted from a trend line, I tested instead: a control chart, a trend regression and an ANOVA all said turnaround was stable, killing a draft claim that it was drifting worse. Which site you are in explains 33.8% of the variance in turnaround; which quarter it is explains 1.8%. I adopted a standing rule partway through: before any claim goes on a slide, check it against all nine sites and for materiality. That rule caught, among others, a "3x the next site" figure that was actually 2.25x once checked properly.
3The outcome
of the portfolio's net occupancy decline traced to a single site.
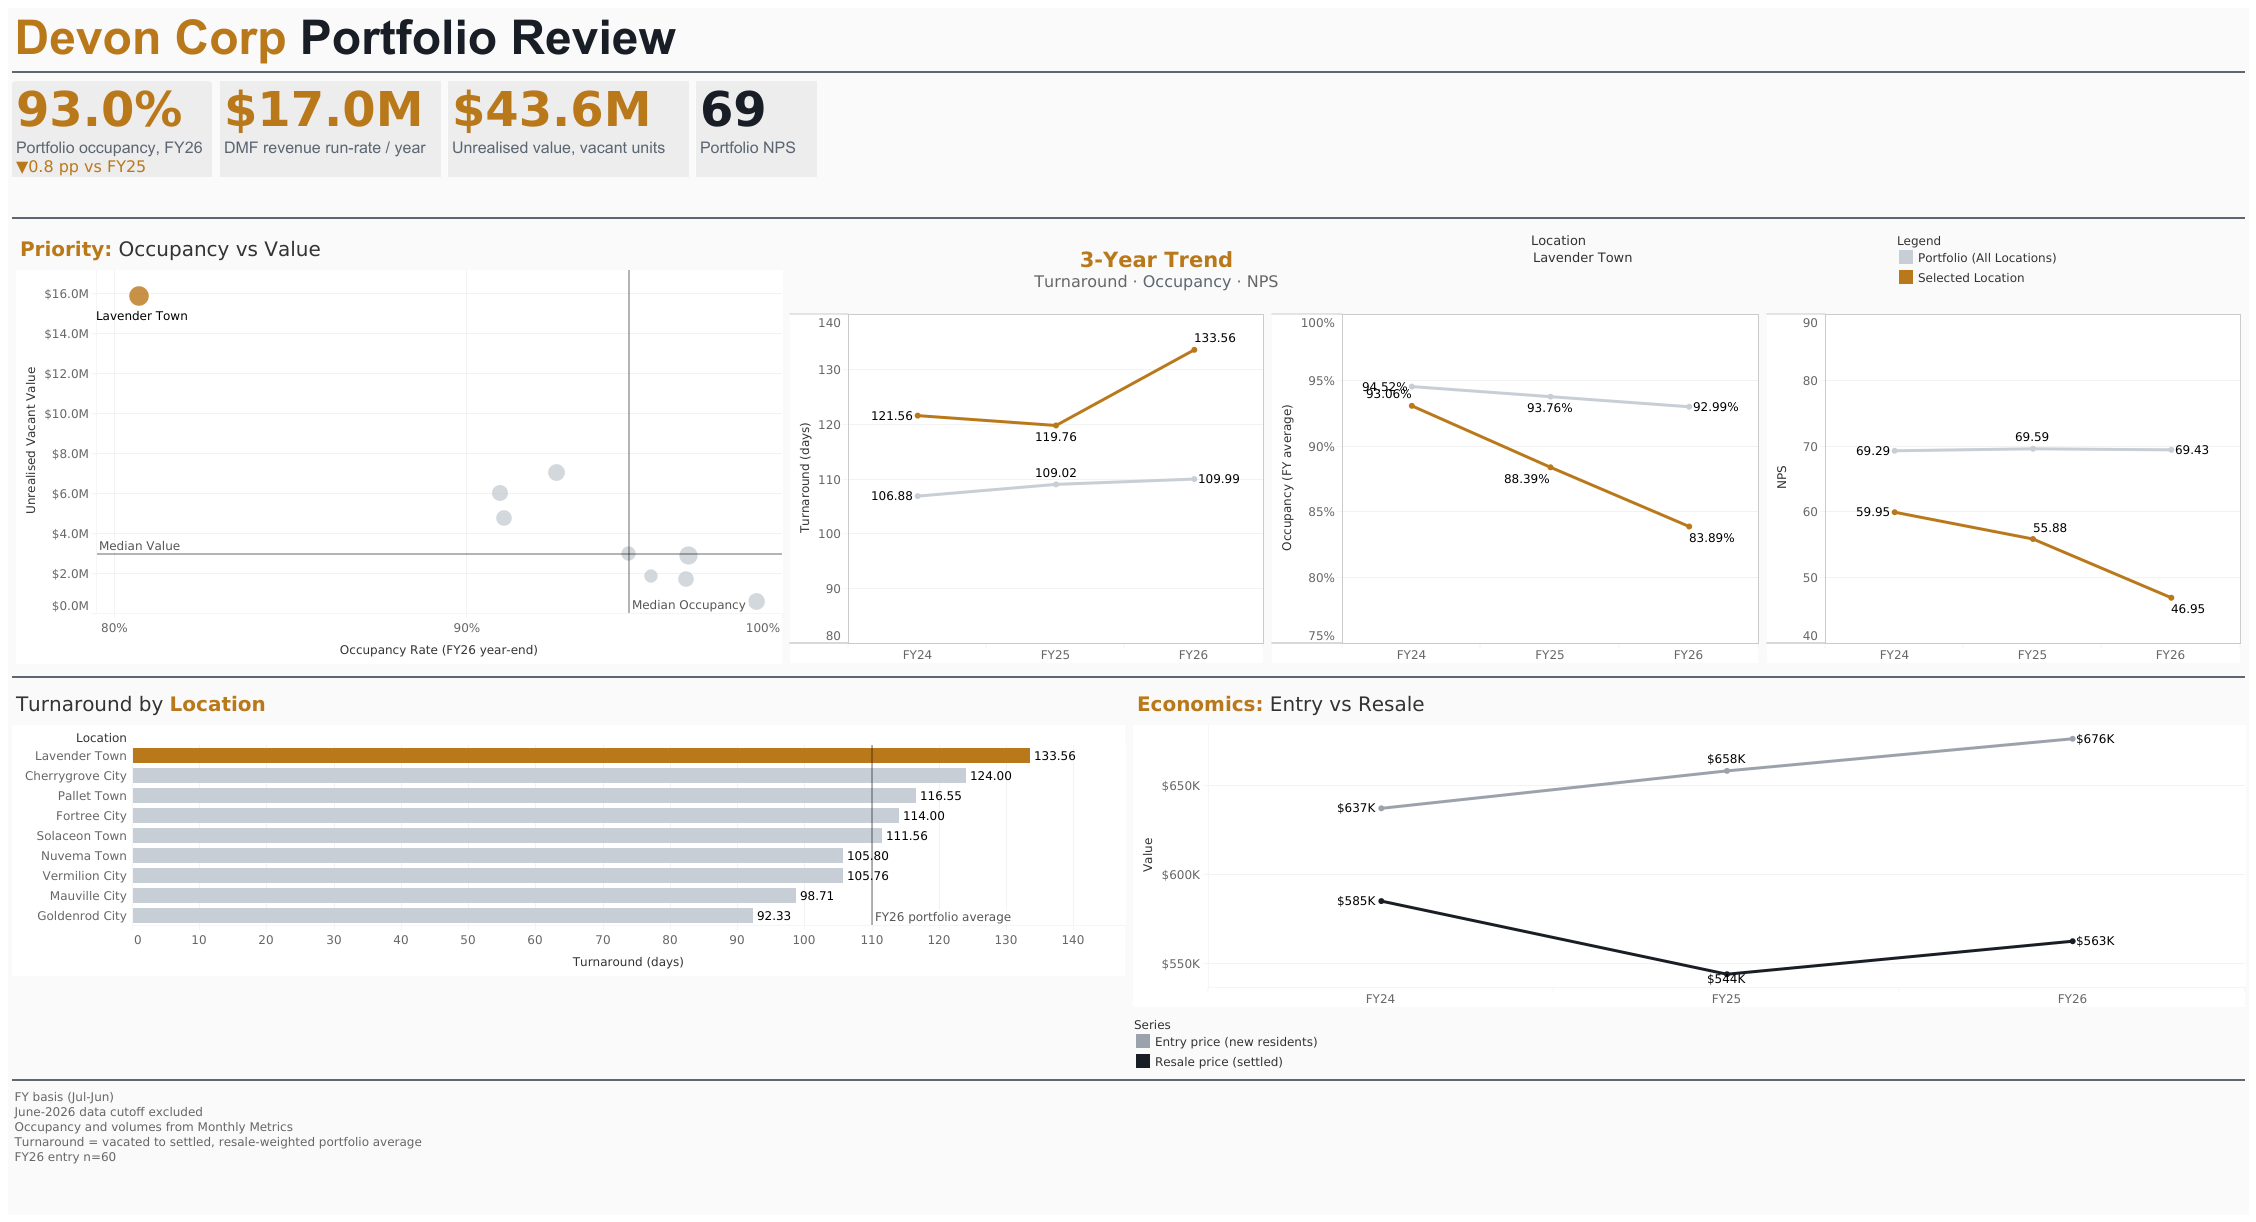
That site sat at 83.9% occupancy against a portfolio average of 93.0%, with the next-worst site at 91.1%. And it isn't a size effect: per unit it holds $105.6k of unsold value against $64.0k at the next site, 1.65x the runner-up after adjusting for scale. The dashboard's visual grammar does one job: neutral everywhere, with a single emphasis colour reserved for the hero numbers and the one site that needed attention. The emphasis colour doesn't decorate. It points.
The recommendation was four actions, in order, each with an owner.
- Fix that one site first (Board). Lifting it to portfolio-average occupancy, about 18 units, would release close to $10M of the value residents pay on entry; clearing its vacancy entirely, $15.8M.
- Diagnose before spending (Ops). Demand there is healthy and it converts above portfolio average, so more marketing won't fix it. Satisfaction is the one signal where the site is a true outlier.
- Set an explicit sales task (Sales). 69 vacant units on hand, and eleven units of occupancy eroded in the final year.
- Investigate flat resale pricing (Finance). Entry prices are rising while resale is not, which is a portfolio-wide issue and not this site's story.
Gross opportunity, not a forecast: it assumes the units sell, and excludes refurbishment, marketing and incentives.
4The limits
Three things this analysis can't answer. There is no target or industry benchmark anywhere in the data, so nothing here says whether 93% occupancy is good or bad, only that it fell. There is no sales lead-time data beyond turnaround, so the honest answer to "how long would a fix take" is that site's 134 days and nothing better. And the move-in and move-out counts don't reconcile with the occupancy balance, which is a data-quality problem to raise at source with agreed definitions rather than paper over downstream.
Those are the questions I'd open with, not close with.